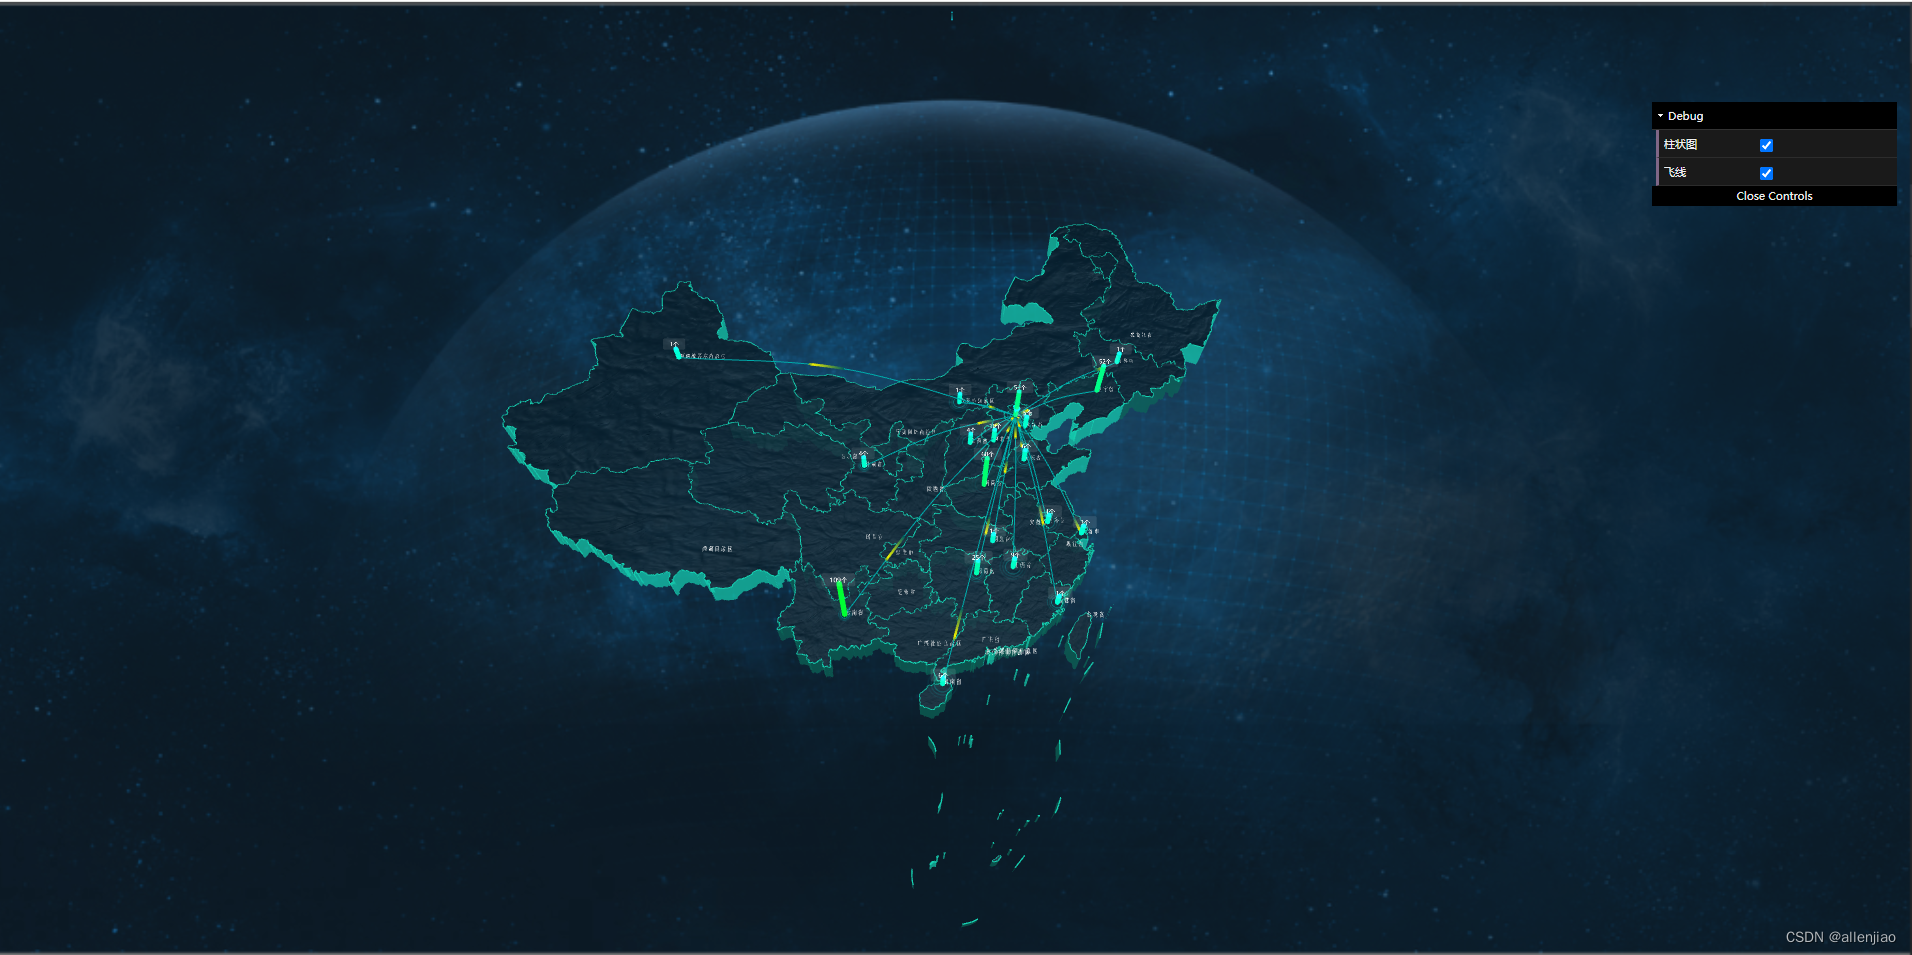
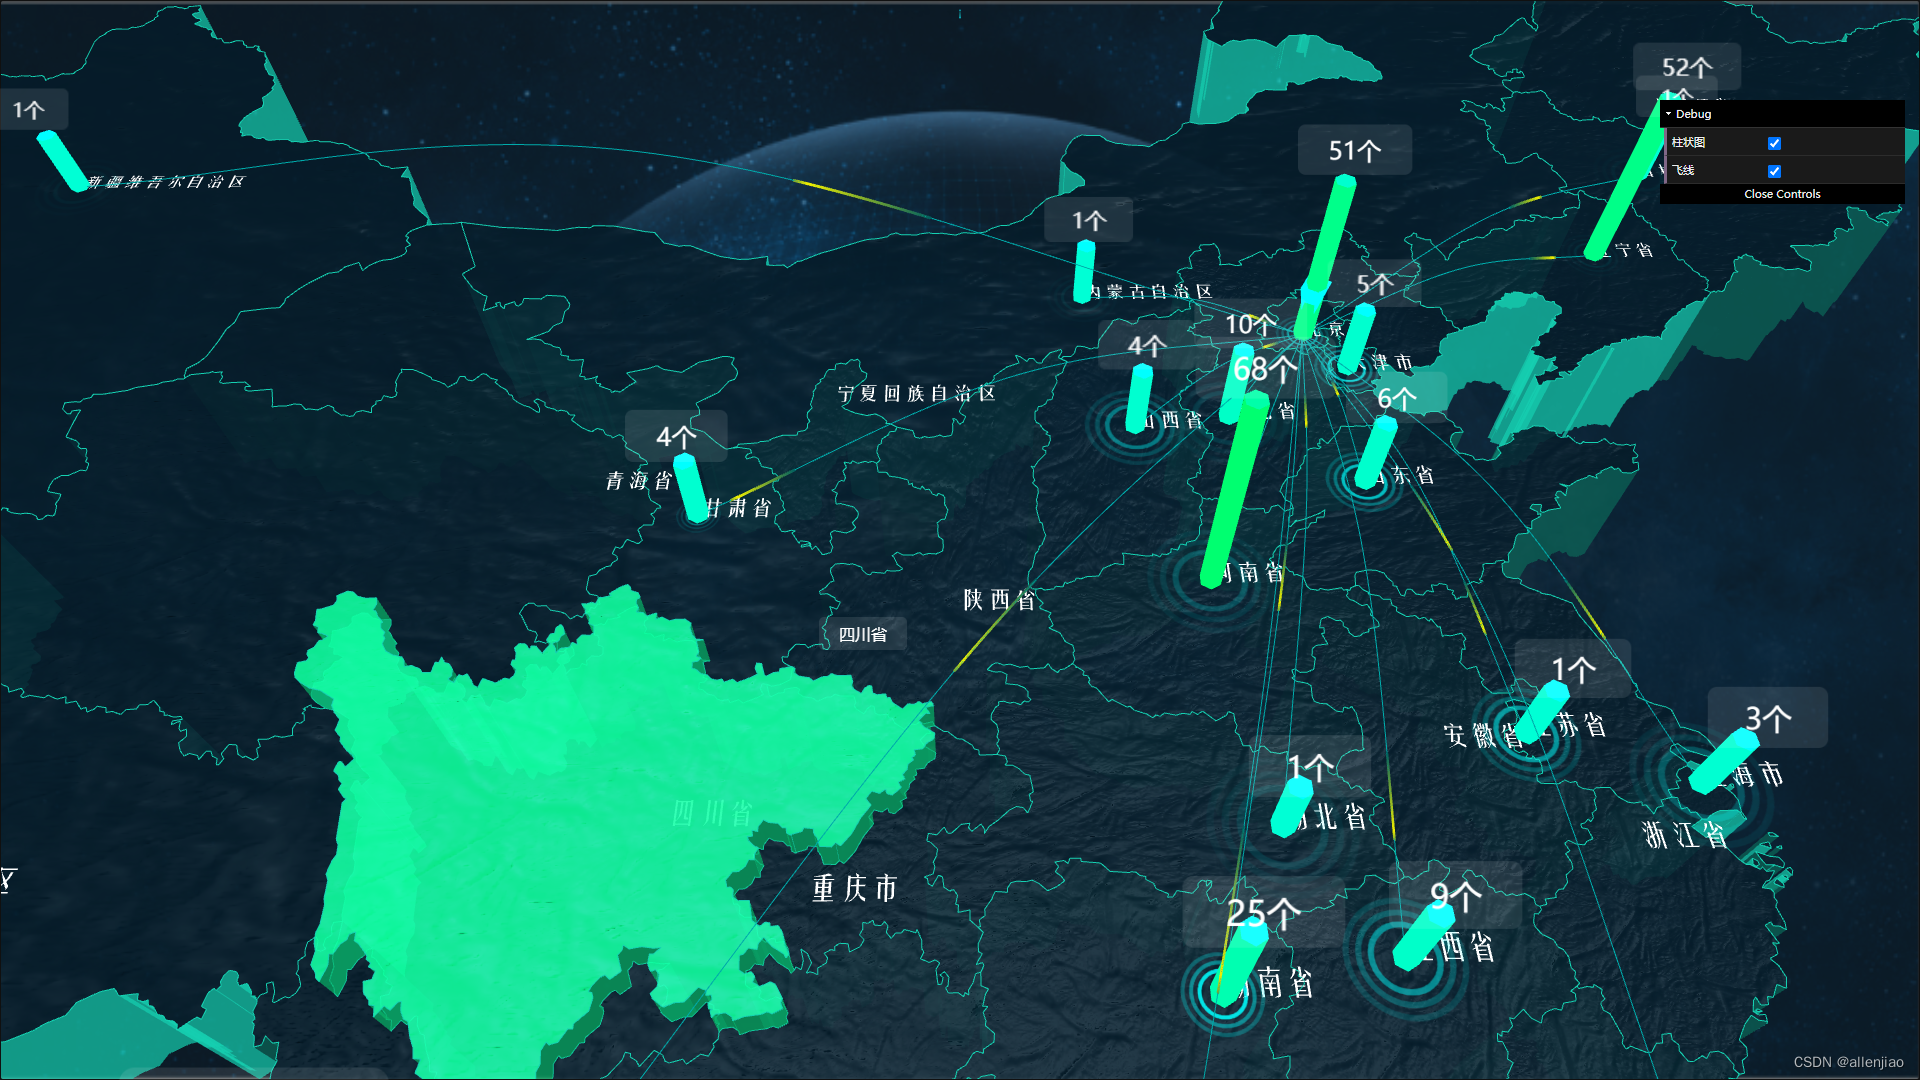
three.js 3D可视化地图
threejs地图
可视化地图——three.js实现
this.provinceInfo = document.getElementById('provinceInfo');
// 渲染器
this.renderer = new THREE.WebGLRenderer({
   antialias: true
});
this.renderer.setSize(window.innerWidth, window.innerHeight);
this.container.appendChild(this.renderer.domElement);
this.labelRenderer = new THREE.CSS3DRenderer(); //新建CSS3DRenderer
this.labelRenderer.setSize(window.innerWidth, window.innerHeight);
this.labelRenderer.domElement.style.position = 'absolute';
this.labelRenderer.domElement.style.top = 0;
document.body.appendChild(this.labelRenderer.domElement);
// 场景
this.scene = new THREE.Scene();
// 假设 scene 是一个 Scene 对象
const textureLoader = new THREE.TextureLoader();
this.scene.background = textureLoader.load("img/bg.png");

// 相机 透视相机
this.camera = new THREE.PerspectiveCamera(45, window.innerWidth / window.innerHeight, 0.1, 1000);
this.camera.position.set(this.orbitParams.pos.x, this.orbitParams.pos.y, this.orbitParams.pos.z);
this.camera.lookAt(this.orbitParams.target.x, this.orbitParams.target.y, this.orbitParams.target.z);
地图数据的加载渲染
this.map = new THREE.Object3D();
this.map.add(cityPointGroup);
this.map.add(cityGroup);
this.map.add(flyGroup);
let _this = this;
_this.maptext = [];
const projection = d3.geoMercator().center([104.0, 37.5]).scale(80).translate([0, 0]);
let pintArr = [];
const textureLoader = new THREE.TextureLoader();
const material = new THREE.MeshPhongMaterial({
   color: '#03121b',
   transparent: true,
   normalScale: new THREE.Vector2( 0.150, 0.150 ),
   normalMap: textureLoader.load( 'img/OIP-C.jpg' ),
   opacity: 0.9
});
const material1 = new THREE.MeshBasicMaterial({
   color: '#15d0b1',
   transparent: true,
   // normalMap: textureLoader.load( 'img/earth_normal_2048.jpg' ),
   opacity: 0.7
});
chinaJson.features.forEach(elem => {
   // 定一个省份3D对象
   const province = new THREE.Object3D();
   // 每个的 坐标 数组
   const coordinates = elem.geometry.coordinates;
   // 循环坐标数组
   coordinates.forEach(multiPolygon => {
      multiPolygon.forEach(polygon => {
         const shape = new THREE.Shape();
         const lineMaterial = new THREE.LineBasicMaterial({
            color: '#15d0b1',
         });
         const lineGeometry = new THREE.Geometry();
         let boundingBox = {
            max: { x:undefined,y:undefined },
            min: { x:undefined,y:undefined }
         };
         for (let i = 0; i  boundingBox.max.x) boundingBox.max.x = x;
            if(-y > boundingBox.max.y) boundingBox.max.y = -y;
            if(x
免责声明:我们致力于保护作者版权,注重分享,被刊用文章因无法核实真实出处,未能及时与作者取得联系,或有版权异议的,请联系管理员,我们会立即处理!
部分文章是来自自研大数据AI进行生成,内容摘自(百度百科,百度知道,头条百科,中国民法典,刑法,牛津词典,新华词典,汉语词典,国家院校,科普平台)等数据,内容仅供学习参考,不准确地方联系删除处理!
图片声明:本站部分配图来自人工智能系统AI生成,觅知网授权图片,PxHere摄影无版权图库和百度,360,搜狗等多加搜索引擎自动关键词搜索配图,如有侵权的图片,请第一时间联系我们,邮箱:ciyunidc@ciyunshuju.com。本站只作为美观性配图使用,无任何非法侵犯第三方意图,一切解释权归图片著作权方,本站不承担任何责任。如有恶意碰瓷者,必当奉陪到底严惩不贷!


